Understanding Pixel Arrays
Now we're ready to dig into what makes an image in numbers. For this, we use PIL or Pillow, depending on what you were able to install (depending on your Python bit-version).
# if you are on 32 bit os
# import Image

# 64 bit with pillow:
from PIL import Image
import numpy as np
Use whichever import you need to use, depending on your bit-version. I use PIL because I am using a 64-bit version of Python.
We are then just importing numpy as np. Numpy is used for number-crunching.
Now let's see our image in numbers.
i = Image.open('images/dot.png')
iar = np.asarray(i)
print(iar)
First we open the image using our image processor. Then we are saving the NumPy array version to iar, then outputting to console.
The output should look something like this, with non-chopped data:
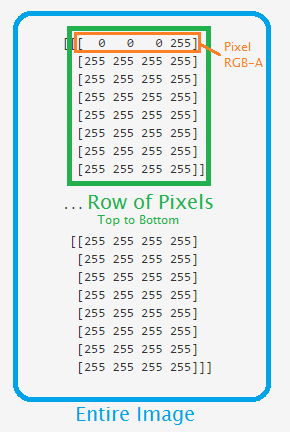
[[[  0   0   0 255]
  [255 255 255 255]
  [255 255 255 255]
  [255 255 255 255]
  [255 255 255 255]
  [255 255 255 255]
  [255 255 255 255]
  [255 255 255 255]]

...

 [[255 255 255 255]
  [255 255 255 255]
  [255 255 255 255]
  [255 255 255 255]
  [255 255 255 255]
  [255 255 255 255]
  [255 255 255 255]
  [255 255 255 255]]]
Here is a 3-dimensional array of the data. All of the data is the image, each matrix block is a row of data, and each element within that is the pixel values in RGB-A (Red Green Blue Alpha). Here's a picture that should help: